Introduction to Excel Pivot Tables

Excel Pivot Tables are a powerful tool for data analysis, allowing users to summarize, analyze, and visualize large datasets. One common task when working with Pivot Tables is counting distinct values in a dataset. In this article, we will explore how to use Excel Pivot Tables to count distinct values, including the use of the Distinct Count function and other methods.
What is a Distinct Count in Excel Pivot Tables?

A distinct count in Excel Pivot Tables refers to the number of unique values in a dataset. For example, if you have a list of customers and you want to know how many unique customers you have, you would use a distinct count. This is different from a regular count, which would count each occurrence of a customer, even if they appear multiple times in the dataset.
Using the Distinct Count Function in Excel Pivot Tables

To use the distinct count function in Excel Pivot Tables, follow these steps:
- Select the cell where you want to create the Pivot Table.
- Go to the Insert tab and click on PivotTable.
- Choose the dataset you want to analyze and click OK.
- In the Pivot Table Fields pane, drag the field you want to count distinct values for to the Row Labels area.
- Right-click on the field in the Row Labels area and select Value Field Settings.
- In the Value Field Settings dialog box, click on the Summarize by dropdown menu and select Distinct Count.
📝 Note: The Distinct Count function is only available in Excel 2013 and later versions.
Alternative Methods for Counting Distinct Values

If you are using an earlier version of Excel or prefer not to use the Distinct Count function, there are alternative methods for counting distinct values:
- Using a formula: You can use a formula such as
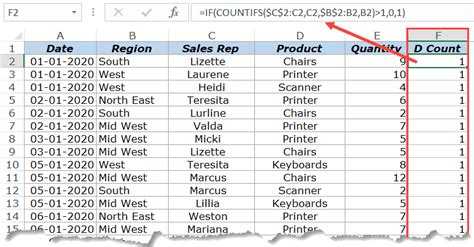
=SUM(IF(FREQUENCY(range, range)>0, 1, 0))to count distinct values. - Using a helper column: You can create a helper column with a formula such as
=IF(COUNTIF(range, range)=1, 1, 0)and then sum up the values in the helper column.
Example of Counting Distinct Values in a Pivot Table
Suppose we have a dataset with customer names and order dates, and we want to count the number of unique customers who have placed an order in each month.
| Customer Name | Order Date |
|---|---|
| John Smith | 2022-01-01 |
| Jane Doe | 2022-01-05 |
| John Smith | 2022-02-01 |
| Bob Johnson | 2022-02-15 |

To count the number of unique customers who have placed an order in each month, we can create a Pivot Table with the customer name in the Row Labels area and the order date in the Column Labels area. We can then use the Distinct Count function to count the number of unique customers in each month.
Best Practices for Counting Distinct Values in Pivot Tables

When counting distinct values in Pivot Tables, keep the following best practices in mind:
- Use the Distinct Count function: If you are using Excel 2013 or later, use the Distinct Count function for accurate results.
- Use a unique identifier: Use a unique identifier such as a customer ID or order ID to count distinct values.
- Avoid using formulas: Avoid using formulas to count distinct values, as they can be error-prone and slow.
In summary, counting distinct values in Excel Pivot Tables is a powerful tool for data analysis. By using the Distinct Count function or alternative methods, you can accurately count unique values in your dataset. Remember to follow best practices such as using a unique identifier and avoiding formulas to ensure accurate results. With practice and experience, you can become proficient in using Pivot Tables to count distinct values and gain valuable insights into your data.
What is the difference between a regular count and a distinct count in Excel Pivot Tables?

+
A regular count counts each occurrence of a value, while a distinct count only counts unique values.
Can I use the Distinct Count function in earlier versions of Excel?
+
No, the Distinct Count function is only available in Excel 2013 and later versions.
How can I count distinct values in a Pivot Table if I am using an earlier version of Excel?

+
You can use alternative methods such as using a formula or creating a helper column to count distinct values.
